To get a human or AI tutor to help you, click Register
Sample Question 22:
Step 1: Calculate the area of the shaded region for each figure.
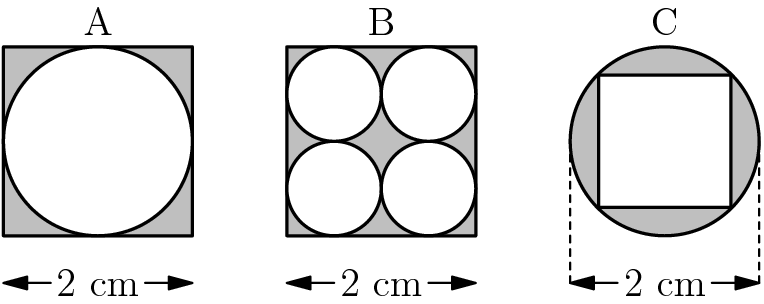
- For figure A, the shaded area is the area of the square minus the area of the circle. This gives us \(2^2-1^2 \pi=4-\pi\).
- For figure B, the shaded area is the area of the square minus the sum of the areas of the 4 circles. This results in \(2^2-4 \left( \left( \frac{1}{2} \right)^2 \pi \right)=4-4 \left(\frac{\pi}{4} \right)=4-\pi\).
- For figure C, the shaded area is the area of the circle minus the area of the square. Given the diameter of the circle and the diagonal of the square both equal to 2, the area of the square can be calculated using the formula \(\frac{d_1 d_2}{2}\). So, the shaded area is \(1^2 \pi-\frac{2\cdot{2}}{2}=\pi-2\).
Step 2: Compare the calculated areas. The largest one among the three shaded regions is \(\pi-2\).
Step 3: Conclude that the figure with the largest shaded area is figure C.
The following figures are composed of squares and circles. Which figure has a shaded region with largest area? 
\(\textbf{(A)}\ \text{A only}\qquad\textbf{(B)}\ \text{B only}\qquad\textbf{(C)}\ \text{C only}\qquad\textbf{(D)}\ \text{both A and B}\qquad\textbf{(E)}\ \text{all are equal}\)
Answer Keys
Question 22: CSolutions
Question 22Step 1: Calculate the area of the shaded region for each figure.
- For figure A, the shaded area is the area of the square minus the area of the circle. This gives us \(2^2-1^2 \pi=4-\pi\).
- For figure B, the shaded area is the area of the square minus the sum of the areas of the 4 circles. This results in \(2^2-4 \left( \left( \frac{1}{2} \right)^2 \pi \right)=4-4 \left(\frac{\pi}{4} \right)=4-\pi\).
- For figure C, the shaded area is the area of the circle minus the area of the square. Given the diameter of the circle and the diagonal of the square both equal to 2, the area of the square can be calculated using the formula \(\frac{d_1 d_2}{2}\). So, the shaded area is \(1^2 \pi-\frac{2\cdot{2}}{2}=\pi-2\).
Step 2: Compare the calculated areas. The largest one among the three shaded regions is \(\pi-2\).
Step 3: Conclude that the figure with the largest shaded area is figure C.