To get a human or AI tutor to help you, click Register
Sample Question 3:
Step 1: Identify the highest and lowest prices from the graph. The highest price was recorded in Month 1, which was $17. The lowest price was recorded in Month 3, which was $10.
Step 2: To find by what percent the highest price of $17 is more than the lowest price of $10, we first find what $17 is as a percent of $10 by using the formula: \(\frac{17}{10} \times 100 = 170\% \).
Step 3: Since $17 is 170% of $10, it means it is 70% more than $10. We find this by subtracting 100% from 170%, which gives us 70%.
So, the highest price is 70% more than the lowest price. The answer is \(\textbf{(C)}\ 70\).
The graph shows the price of five gallons of gasoline during the first ten months of the year. By what percent is the highest price more than the lowest price?
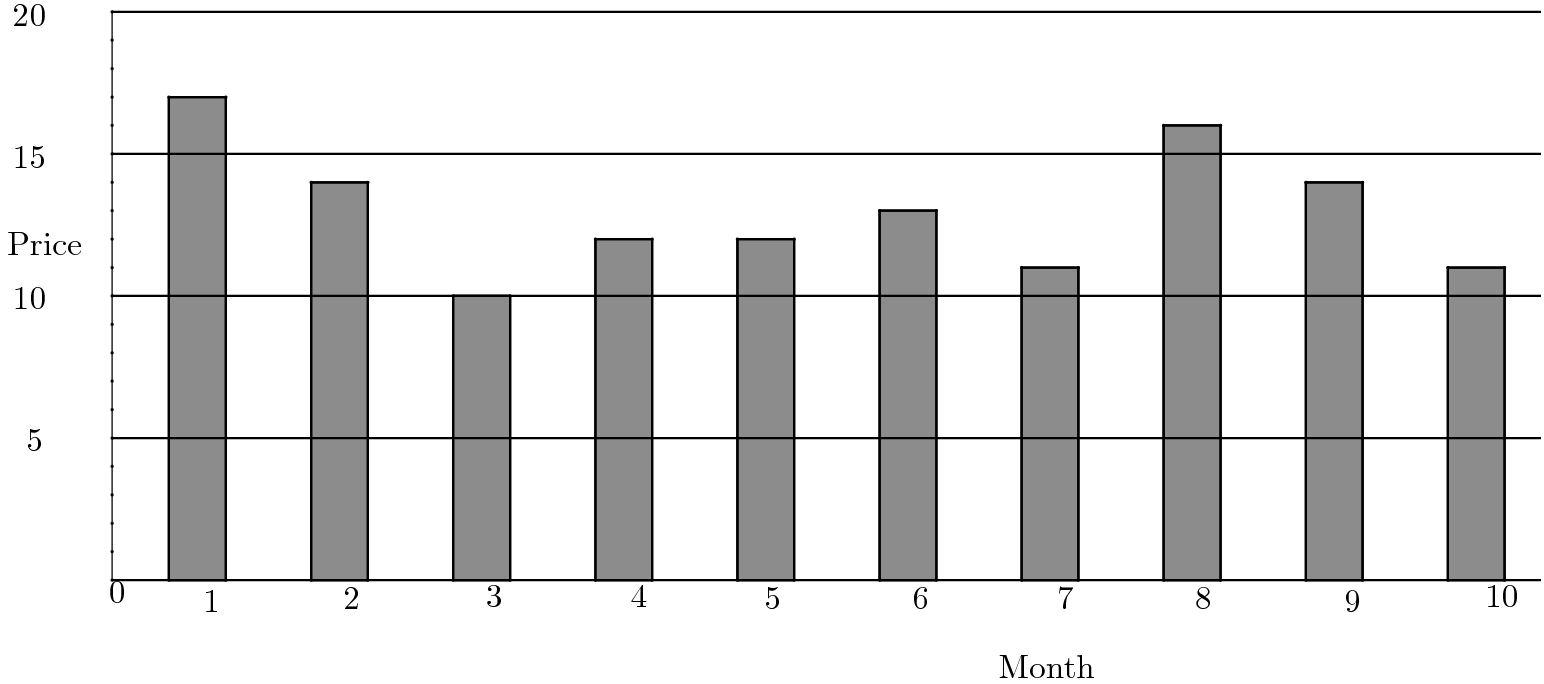
\(\textbf{(A)}\ 50 \qquad \textbf{(B)}\ 62 \qquad \textbf{(C)}\ 70 \qquad \textbf{(D)}\ 89 \qquad \textbf{(E)}\ 100\)
Answer Keys
Question 3: CSolutions
Question 3Step 1: Identify the highest and lowest prices from the graph. The highest price was recorded in Month 1, which was $17. The lowest price was recorded in Month 3, which was $10.
Step 2: To find by what percent the highest price of $17 is more than the lowest price of $10, we first find what $17 is as a percent of $10 by using the formula: \(\frac{17}{10} \times 100 = 170\% \).
Step 3: Since $17 is 170% of $10, it means it is 70% more than $10. We find this by subtracting 100% from 170%, which gives us 70%.
So, the highest price is 70% more than the lowest price. The answer is \(\textbf{(C)}\ 70\).